Posts

Showing posts from May, 2018

No Logic Only Magic. Python

Learn Python for data science  ; Java  -  int a=10;             int b=20            int temp; temp=a; a=b; b=temp; ===================================================== x=10 y=20 x,y=y,x ======================================================= String name="GOVIND" SOP(name) ================= English Statement : name="Govind" print(name) ====================================  

Eigen Value and Eigen Vecctor

Let A is the square matrix of order n*n ,then a number  lambda is set to be Eigen value of matrix A if there exists a column matrix  X of order   n*1 such that AX=lambdaX It menas that , if column matrix A , A*X= lambda*X then  lmbda is called eigen value of  A. X-eigen vector of A.  AX-lambdaX=0 A-(Lambda*I )X=0 Eigen Value - chrecteristics value Eigen Vector- Characteristic Vecor Working rule to find Eigen Value and Eigen Vector : First u need to create characteristic equations of matrix A, it is determinate of  | A-lambda *I| = 0 I - is the square matrix . Solutions of characteristics equations  is called Eigen values , on the basis of egen values  corespoing we can find egen vector .

Simple Linear Regression : Machine Learning Practical - Number Of experiance vs Salary

Image
- It is the Study of two variables. - One variable is called as In Dependent variable.(x) - And Other Variable is called as Dependent Variable(y)  Example : Salary dependent on Number Of experience U have. - So in this example we can say that : Salary  is dependent variable    and Experience is Independent variable. - It is used for predictions.  - Here  we try to predict  the change in dependent variable according to change in independent variable. Regression    y=a+bx; Here y is dependent variable and x is called as Independent Variable .                                  In this example sales is dependent on price  : sales dependents on prince  In this Example Salary is Dependent Variable and Number of Years of Experience is Independent.  Created on Fri May 25 18:53:42 2017 @author: Govind """ import numpy as mp #this library help to chart graphs import matplotlib.pyplot as plt import pandas as pd import os os.chdir('

Machine Learning : Linear regression

Image
    Linear regression attempts to model the relationship between two variables by fitting a linear equation to observed data.   One variable is considered to be an explanatory variable, and the other is considered to be a dependent variable.     Dependent Variable – Variable who’s values we want to explain or forecast Independent or explanatory Variable that Explains the other variable. Values are independent. Dependent variable can be denoted as y, so imagine a child always asking y is he dependent on his parents.    And then you can imagine the X as your ex boyfriend/girlfriend who is independent because they don’t need or depend on you. A good way to remember it.    Anyways Used for 2 Applications To Establish if there is a relation between 2 variables or see if there is statistically signification relationship between the two variables- • To see how increase in sin tax has an effect on how many cigarettes packs are consumed • Sleep hours vs

Machine Learning : Supervised vs Unsupervised Learning

Image
Wiki Supervised Learning Definition          Supervised learning is the Data mining task of inferring a function from labeled training data.The training data consist of a set of training examples. In supervised learning, each example is a pair consisting of an input object (typically a vector) and a desired output value (also called the supervisory signal). A supervised learning algorithm analyzes the training data and produces an inferred function, which can be used for mapping new examples. An optimal scenario will allow for the algorithm to correctly determine the class labels for unseen instances. This requires the learning algorithm to generalize from the training data to unseen situations in a “reasonable” way. Wiki Unsupervised Learning Definition In Data mining, the problem of unsupervised learning  is that of trying to find hidden structure in unlabeled data. Since the examples given to the learner are unlabeled, there is no error or reward signal to

Data Mining -[Data, Information, Knowlade,Architecture , Examples]

Image
1. Data mining is the process of analyzing data from different perspective and summarizing  it into useful information. 2. Data : Extracting knowledge  from large amount of  data is called data mining. ex u search google  , u get whatever u want with the help of data mining . gold mining. Data    fact or raw material , unprocessed things ex 250- currently it is data, it has no meaning.   Information -  processing the data : -processing means -  giving some meaning to data   Information inform you something. In other words ,it must have some meaning , at this stage you will processed your data  and put it into context. Take earlier example of data which was 250. we could now give it a meaning  that is we could say that it means 250 student  But this doesn't really inform us anything , now we need to put it into context. Now we can fully converted our data into information by not only saying 250 student , but by adding

Data Mining part -1 : Data Generate Per Day- 4 million terabyte

Each minute of every day the following happens on the internet: Social Media is HUGE – Reports show that social media gains 840 new users each minute . Since 2013, the number of Tweets each minute has increased 58% to more than 455,000 Tweets PER MINUTE in 2017 ! Youtube usage more than tripled from 2014-2016 with users uploading 400 hours of new video each minute of every day! Now, in 2017, users are watching 4,146,600 videos every minute. Instagram users upload 46,740 million posts every minute! Since 2013, the number of Facebook Posts shared each minute has increased 22%, from 2.5 Million to 3 million posts per minute in 2016. This number has increased more than 300 percent, from around 650,000 posts per minute in 2011! Every minute on Facebook: 510,000 comments are posted, 293,000 statuses are updated, and 136,000 photos are uploaded. Facebook users also click the like button on more than 4 million posts every minute ! 3,607,080 Google searches are conducted worldw

What makes aGood Features? Machine Learning Recipes.

Classifier are only as goof as the features you provide. that means coming up with good features, is one of the most important jobs in machine learning. But what makes a good feature and how can you tell ? If you are doing binary classification , then a good feature makes it easy to decide between things. ex- imagine we wanted to write a classifier to tell the difference between two dogs , greyhounds and labradors here we will use two features , the dogs height in inches and there eye color just for this toy example , lets make couple assumptions about dogs to keep things simple First - greyhounds usually taller than  labradors , next we will pretend that dogs have only two eye colors - blue and brown and we will say the color of eyes does not depends on breed of dog, this mean that one of these features is usefull and other tells us nothing.  

Supervised Learning : PRACTICAL Decision Tree classifier- Apple / Orange Classifier :

Image
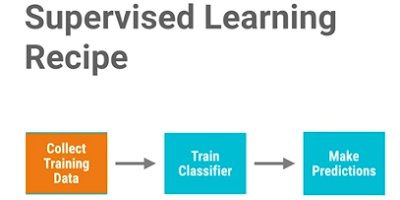
Supervised Learning Recipe : 1. collect training data : These are the examples of problem we wan to solve.     for our problem we are going to write function  to classify piece of fruit. we will take a description of the fruit as input and predict weather its apple or an orange as output based on features. like texture(bumpy ,smooth) and wait To collect our training data imagine we haed out to an orchard. we will look at different apples and oranges  and write down measurements that describe them in a table. In Machine Learning these measurement called features . To  keep things simple we just used two. How much each fruit weights in grams and its texture which can be bumpy or smooth. A good features makes it easy to discriminate between different types of fruit . Each row in our training data is an example , it describes one piece of fruit.. The last column is called the label. It identifies what type of fruit in each row. and there are just two possibili

Decision Tree classifier on Iris data Sets Using Python sklearn

Image
 DataSet link : https://en.wikipedia.org/wiki/Iris_flower_data_set#Use_of_the_data_set from sklearn.datasets import load_iris #iris flower data set available in sklearn  #contain features and labels , like sapal length , sapal width , patellength #this data set avlbl in sklearn so we import from sklearn from sklearn import tree #to used decision tree classifier we need to import tree import numpy as np iris=load_iris() # load the dataset print (iris.feature_names) #print the features name print (iris.target_names) #print labels (target name) print (iris.data[ 0 ]) # length width print of first flower print (iris.target[ 0 ]) #print label of zero flower removed = [ 0 , 50 , 100 ] #removed this 3 rows from data set to find accuracy new_target=np.delete(iris.target , removed) new_data=np.delete(iris.data , removed , axis = 0 ) clf=tree.DecisionTreeClassifier() clf = clf.fit(new_data , new_target) //test prediction what is [0,50,100] prediction=clf.predic

Data Science : Creating a news reader Python

Image
Go to newsapi  website and get url for any news channel . To code in python you need to add dependency for this run below command pip install newsapi-python and here is the code import urllib.request as urlr import json r=urlr.urlopen("http://newsapi.org/v2/top-headlines?sources=the-times-of-india&apiKey=460981db9cf744c08c14a5fc295431ac") a=json.loads(r.read().decode()); for i in range(0,5):     print(a['articles'][0]['title']) input()

Sentiment Analysis From tweeter

Sentiment Analysis  : Understanding and Extracting Feelings From Data An API lets you access an apps functionality from your code Note  : go to tweeter developer and generate secrete key , secrete access key, access token key , and access secrate token key TextBlob is awesome for NLP task pip install tweepy pip install textblob  import tweepy from textblob import TextBlob c_k= "ZTLY86W4SB7x8f5AsDrTYcIDG" c_s= "n4dWcwOYz19XS7FGRKWJt45jumtdHhw7njbKU64r3C0sMmAj8W" a_t= "497554636-3fXu3jG70a8P4sICR88Dnr8TYmMEKQn3LDVM6jiE" a_t_s= "GPfOWs5WH5cTWmUQs4O1BRPy3LPwkbFhmhtOABdjLZDEc" auth=tweepy.OAuthHandler(c_k , c_s) auth.set_access_token(a_t , a_t_s) api = tweepy.API(auth) public_tweets = api.search( "Amit Shah" ) for tweet in public_tweets: print (tweet.text) analysis=TextBlob(tweet.text) print (analysis.sentiment)

Installation python and Its Dependancy

Installing PIP (Python package Manager) pip install -U pip Adding dependancy by pip pip install -U scikit-learn

PyCharm IDE for Python On linux machine installtoin

Image
Step 1:  Type below link on URL and download IDE first             http://www.jetbrains.com/products.html#lang=python Step 2:  After downloading completion just extract the folder  Step 3:  copy pycharm bin folder path and set on terminal